
Alcohol is the most commonly consumed drug in the world. Harmful alcohol use accounts for 5% of the global disease burden, or 1 in 20 deaths, according to the World Health Organization. Heavy drinking has grown substantially more prevalent during the COVID-19 pandemic. Bluetooth-connected breathalyzers can reliably infer blood alcohol concentrations from exhaled breath and integrate with a smartphone app. Despite the rapid introduction of wearable technology that enables users to monitor and improve their health, we still have much to learn about how best to combat alcohol overuse in digital contexts.
We applied a machine learning (ML) model to the largest international sample of smart-breathalyzer data published to date, and sought to predict breath alcohol concentration (BrAC) levels associated with alcohol-related harms (BrAC ≥.08 g/dL). These findings underscore the potential for smart-breathalyzer apps to offer “Just-in-Time” secondary prevention strategies for interested users, triggered by an ML algorithm such as this one.
The “Digital Exhaust” of Drinking
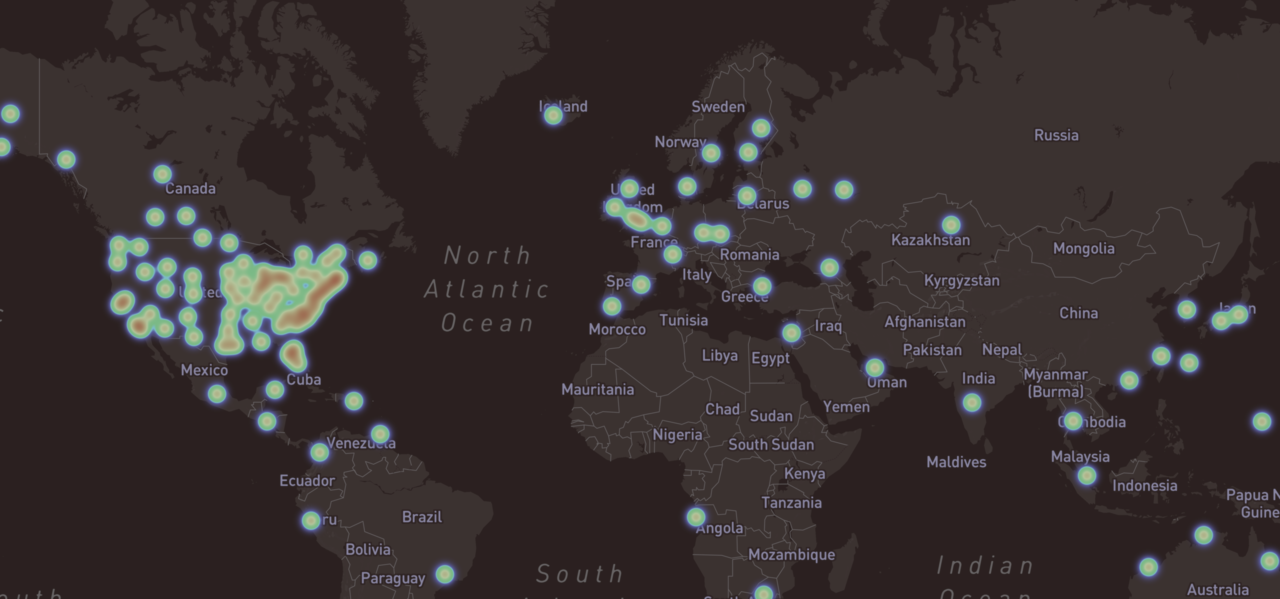
We analyzed roughly one million data-points from 33,452 users of a commercial smart-breathalyzer device (BACtrack) collected between 2013 and 2017, representing 55 countries and 50 United States (see the dynamic world map (Mapbox API) and zoom in to specific regions). One challenge was that, although the data were large-scale, they did not include typical demographics or self-report instruments to assess alcohol risk. Hence, we made predictions based on the “digital exhaust” of behavioral, geolocation, and temporal data related to device and app usage, combined with epidemiologic data.
When and Where We Drink
As expected, users showed the highest BrAC levels in the early morning hours and on weekends (Figure 1A and this dynamic visualization). Utah revealed the lowest mean BrAC values among U.S. states, at 0.035 g/dL, while Montana topped the list of states with 0.133 g/dL.
Figure 1A. BrAC Average by Hour of Day and Day of Week

Figure 1B. BrAC Measurement Geolocation Displayed on the World Map
 |
 |
 |
 |
Impaired Driving Death Rates by State
We considered that users who purchase and use smart-breathalyzers might not be representative of the population. So, we sought to validate whether these findings might inform public health policies, using data from the Centers for Disease Control and Prevention on death rates from impaired driving (per 100,000 population) for people killed in crashes involving a driver with a BAC ≥ 0.08 g/dL for the year 2014. Indeed, states with higher average BrAC levels had significantly higher death rates, adjusting for the number of users per state (Figure 2; also see this dynamic map and click on the background to toggle between BrAC and death rates).
Figure 2. Association of Average BrAC levels with Impaired-Driving Motor Vehicle Death Rates by State

The Machine Learning Model
To train an ML model, we engineered features to reflect a user’s past history of BrAC values and engagement, and used natural language processing to extract users’ reflections on quantity and type of alcohol consumed from notes. We additionally incorporated information about hour of day, day of year, month, year, holidays, and geolocation features reflecting elevation, distances users travelled, and proximity to their last location when utilizing the device. Lastly, we integrated publicly available information on state alcohol taxes, motor vehicle death rates, poverty, and rural/urban spread. Then, we randomly assigned users to train, validation, and test sets (70, 10, 20%) and fit a balanced Gradient Boosting Classification Tree (GBCT) Machine Learning model to predict the likelihood of a BrAC exceeding the legal driving limit (0.08 g/dL).
How Good are the Machine Learning Predictions?
Figure 3. Model Selection and Performance Evaluation

In the independent test set, the ML algorithm predicted the likelihood of a given user-initiated BrAC sample exceeding BrAC≥0.08g/dL, with an AUC of 85% (Figure 3). Users of the BACtrack breathalyzer have the option to record their own subjective BrAC estimate in the app before breathing into the device. Therefore, we used the user’s subjective BrAC estimate to build a baseline model for comparison, which yielded an AUC of 64% (Figure 3, gold line below). In other words, when users predicted their own BrAC levels, their self-predictions were 21% worse than the final model at discriminating whether their BrAC would exceed the legal driving BrAC limit. In contrast, when we removed this single feature from the full model, it only reduced the full model AUC by 3% (blue). To mimic what an app might be able to predict in the absence of the breathalyzer device, we omitted all features generated from the time series of the BrAC values and established that his reduced the AUC by 11% (green). In sum, a users’ BrAC self-estimate was not a prerequisite for good performance.
What Drives the Model’s Performance?
Figure 4 illustrates the ranked SHAP feature importance values in the test set of separate users. The features that contributed the most to model predictions were behavioral factors related to usage or engagement, such as: measured BrAC trends over time, the user’s own subjective BrAC estimate (see this dynamic visualization for more insights), prior self-monitoring episodes, the quantity and frequency of engagement, time since the last BrAC recording, and hour of day.
Figure 4. Explaining Model Performance with Shapley Values

Figure 4: SHAP values quantify the relative impact of each feature on model performance in the hold-out test set of separate users. The horizontal location shows whether the feature is associated with a lower (left) versus higher (right) predicted probability of a high BrAC >=0.08 g/dL) across all observations in the test set. The color demonstrates the directionality of the association. These analyses reveal a prominent role for habitual behavior patterns, self-monitoring, engagement, time of day, and human-in-the-loop features such as self-estimations or verifications.
Self-Monitoring Alone may not be Enough
Figure 5. Users’ capacity to accurately estimate their BrAC (defined as a lower absolute value of the discrepancy between the estimate and actual value) significantly improved over the first five episodes of self-monitoring (B=-.002, 95%CI: -.002 - -.001, z= -18.809, p<.001, 80,833 recordings from 26,056 distinct users). After the first 5 self-monitoring episodes, users’ estimated BrAC values were < .01 g/dL closer to the true BrAC value, most of which occurred after the first episode. This implies that digital self-monitoring of alcohol use alone may not be enough. Users will likely need additional strategies to accurately estimate BrAC and thereby moderate drinking.
Figure 5. Improvements BrAC Discrimination as a Function of Self-Monitoring

Just-in-Time – For Secondary Prevention
Alcohol use is a major preventable behavioral cause of morbidity and mortality. ML-driven algorithms based on breathalyzer data could provide the basis for large-scale, cost-effective interventions geared towards secondary prevention. These results establish the first large-scale, global “snapshot” of naturalistic usage patterns for smart-breathalyzer devices. Moreover, we provide the proof of concept that risk-associated BrAC levels can be predicted with high accuracy simply from the “digital exhaust” of the user’s interaction with a smart-breathalyzer and associated app. Hence, this characterization informs future hypothesis generation for Just-in-Time Precision Medicine interventions guided by ML. Such an algorithm could also be fed automatically and in real-time to warn the user of a likely impending rise in blood alcohol content beyond the legal limit, and prompt the user to consider harm-reduction strategies like interspersing alcoholic drinks with water.
Code written by Kirstin Aschbacher, PhD
https://github.com/kaschbacher/bac


Please sign in or register for FREE
If you are a registered user on Research Communities by Springer Nature, please sign in